By Philip Duplisey – Director Consulting Services
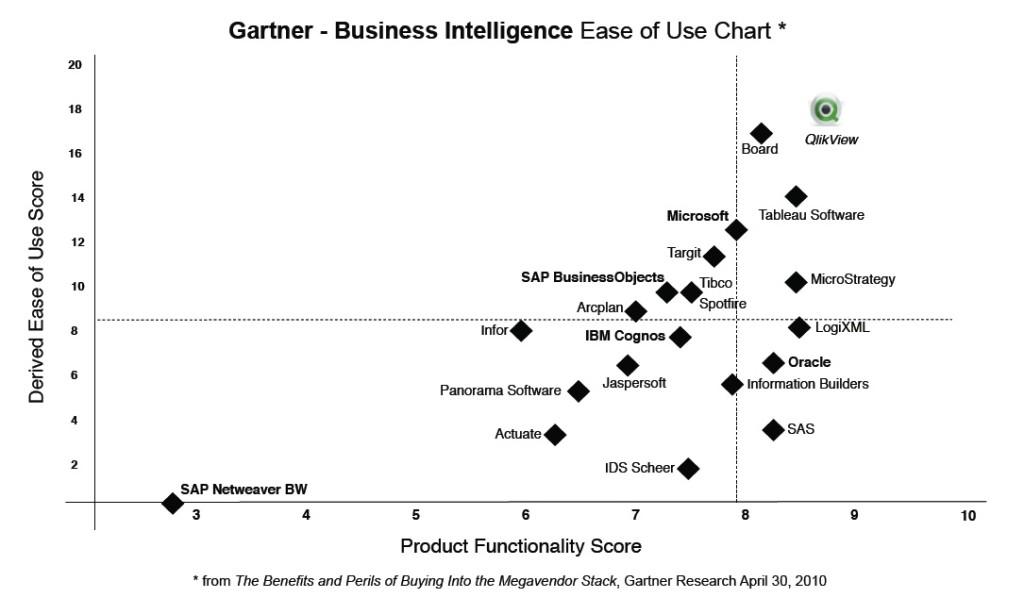
I spent the last few weeks on the road, onsite at clients, and a recurring theme has been the “Ease of Use” of a BI solution and the often times contradictory ability of that software to solve complex business problems. These clients in particular, had extensive experience deploying enterprise wide BI solutions with traditional stack BI vendors, SAP Business Objects and IBM Cognos. (see 2010 Gartner Chart of “Ease of Use” vs. Functionlity.)
The progress we were able to accomplish in a few days and weeks with QlikView astounded them. In their experience, it usually takes months of development before data can even be visualized, and then an equally long period of validation. With QlikView we were checking chart totals in QlikView against their production reports within hours. Moving on in confidence knowing our dataset control totals matched the production reports, we start to build out the visualizations. Most of the first and second day I let them “drive” and use the wizard to create all kinds of interesting visualizations of their data. It’s normal to hear things like, “we’ve never seen this relationship before”, or “this is so easy”!
There are 2 main requirements I have for an engagement to go smoothly:
- Data that is of fairly good quality (QlikView has ETL functionality, so denormalization and transformation of the data is possible, but if the data quality is bad, this process can be time consuming).
- The SME (subject matter expert) I’m working with is exactly that, an expert. They know their data and they know the business processes and workflows that created the data. Also important is that they know how decision making will be supported by the application we build and how those decisions fit into the overall business process.
By the third or fourth day, the customization of the visualizations is starting to tax the general options available in the chart wizard. Instead of a stacked bar graph showing component contribution to the total, they want to try a waterfall chart. Or perhaps instead of filtering data by making selections, they want to end user to be able to come into the dashboard and display the most current data by default. Year on year, Quarter on quarter analysis is also particularly common.
It’s at this point that I take over and demonstrate some of the advanced functionality QlikView has to offer. After admiring the results, I then hear, “that’s great, but our end users aren’t going to master these advanced features”, and that is quite true. QlikView is a product that is BOTH “easy to use” and has deep product functionality. End users can achieve tremendous results very quickly and easily, and at the same time there is depth and breadth to the product that enables it to be able to solve complex business problems.
At the Bardess Group, we specialize in providing expertise on the cutting edge of what’s possible in QlikView. We encourage our clients to go as far as they can in developing solutions to meet their needs, and then calling us in, if required, to incorporate the advanced functionality they require.
About the Author
Philip Duplisey, Director of Consulting Services at Bardess, has been implementing enterprise wide solutions globally at Fortune 500 companies for 15 years. He enjoys enabling the organization to find value in their data, and presenting that data in compelling ways that lead to deeper insights and improved performance.

